What a crazy year in the markets, huh?
Right now we’re experiencing multiple headwinds, including decades-high inflation; a U.S. Federal Reserve that’s about to embark on the most aggressive tightening path since the 1970s; a Russo-Ukrainian war raging in Europe; the highest gas and grocery prices in decades; and more COVID-19 lockdowns in China. As a result, the stock market is off to its worst start to a year since 1942.
Talk about unusual. Aside from being one of the more volatile markets we’ve seen, it’s downright scary.
Against that backdrop, I wouldn’t blame you for wanting to take cover from the storm. But to paraphrase the great Warren Buffett, it’s best to be greedy when others are fearful.
And right now, everyone’s fearful.
The percentage of U.S. individual investors who are bullish on the U.S. stock market sits at 16.4% today — its lowest reading since 1992 (which, yes, means investors are less bullish today than they were at any point during the COVID-19 pandemic, the great financial crisis, or the dot-com crash).
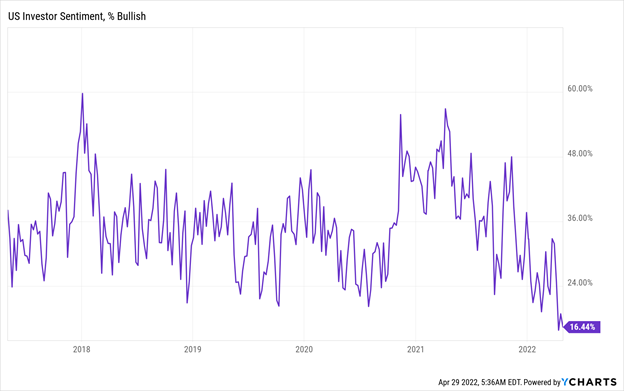
Buffett would tell us to get greedy here. But should we heed those words of advice?
Absolutely.
Over the past several months, my team of elite research analysts and I have embarked on an ambitious project: studying the intricacies of stock market crashes throughout modern history.
And we discovered something amazing.
Specifically, we’ve discovered a rare stock market phenomenon that occurs about once every 10 years. Through back testing, we’ve found that this phenomenon consistently represents the best buying opportunities in the history of the U.S. stock market.
More than that, we figured out how to quantitatively identify the next time this phenomenon occurs. As such, we have engineered a way to take advantage of the next divergence for massive profits.
Well, folks, guess what’s happening right now?
This ultra-rare stock market phenomenon is emerging right now. And, as the window of opportunity to capitalize on this phenomenon is rapidly approaching, our models are flashing bright “buy” signals.
That might sound counterintuitive, considering what’s going in the market right now.
But I’m staking my career on this claim.
Because it’s really not an opinion. It’s a fact.
It’s a fact that I can back up with data, with history, with statistics and mathematics, and with the biggest market phenomenon in history.
Today, we stand on the cusp of an opportunity of a lifetime.
Over the next few days, I will explain this market phenomenon, illustrate its historical significance, show you how it’s happening right now, and, most importantly, I’ll help prepare you to take advantage of this phenomenon.
A once-in-a-decade opportunity is knocking at your door — Will you answer?
Stock Prices Follow Fundamentals
In my early years as an investor, I remember reading book after book, studying lecture after lecture, and talking to hedge fund manager after manager to figure out what type of investment style fits me best.
And by “fits me best,” I mean to say I was trying to figure out what investment style would make me the most money.
I talked to famed value hedge fund managers. I got advice from famed growth investors. I talked to commodities traders, CFOs, and bond titans.
All of them offered me words of wisdom. But none of them really convinced me of what was the best way to make money in the stock market.
And then I came across the following chart. It graphs the earnings per share of the S&P 500 alongside the price of the S&P from 1988 to 2022:
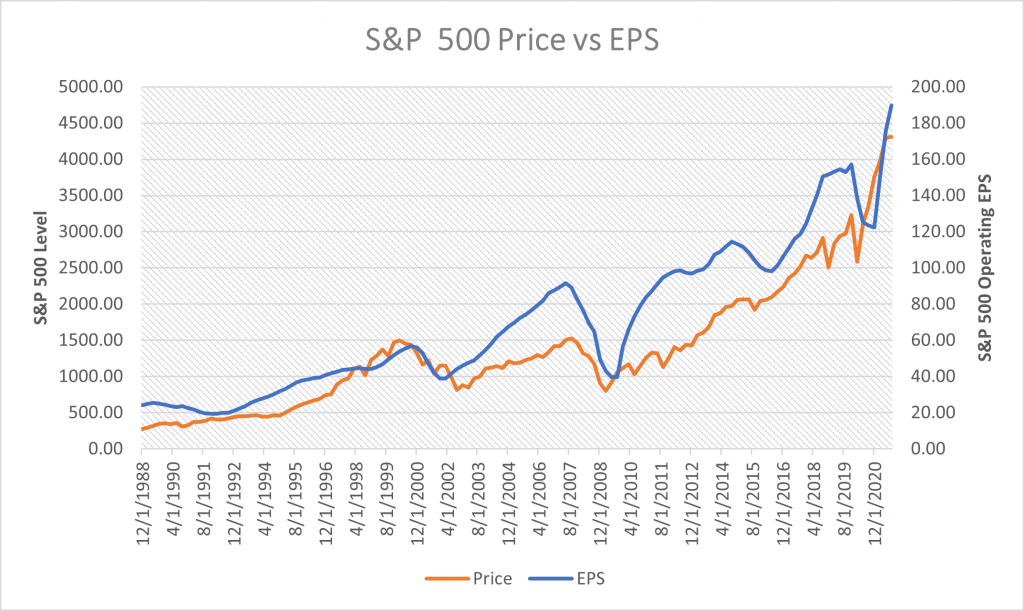
As you can see, the blue line (earnings per share) lines up almost perfectly with the orange line (stock price). With a mathematical correlation of 0.93, the two could not be more strongly correlated. For instance, a perfect correlation is “1.” A perfect anti-correlation is “-1.”
Therefore, the historical correlation between earnings and stock prices is about as perfectly correlated as anything gets in the real world.
After seeing that chart years ago, I was convinced, because there is unequivocally only one way to interpret that chart: Earnings drive stock prices.
Forget the Fed. Forget inflation. Forget geopolitics. Forget trade wars, recessions, depressions, and financial crises.
We’ve seen all of that over the past 40 years — and yet, through it all, the correlation between earnings and stock prices never broke or even faltered at all.
At the end of the day, earnings drive stock prices. History is clear on that. In fact, history is as clear on that as it is on anything, mathematically speaking.
To that end, if you’re looking for the best stocks to buy, you need to find the companies with the best earnings and revenue growth prospects. Companies that grow earnings and revenues the fastest in the long run will see their stock prices rise the fastest.
That’s the core ethos of my investment strategy. It is a historically proven mathematical fact. If I invest in companies that successfully grow their earnings and revenues very quickly over the next several years, the stocks I buy will rise in value by a lot.
It’s a simple yet powerful strategy. Using this, I have selected 21 different stocks and cryptos that have soared more than 10X in value since 2015 alone — quite an impressive feat in such a short time.
Ultra-Rare Divergences Create Huge Opportunities
But… every once in a while… this strategy doesn’t work…because the super-strong correlation between earnings and stock prices “breaks.”
Such breaks are very rare. They happen about once a decade. But each time, they emerge because of macroeconomic fears. And, every time, they produce life-changing gains for savvy investors who capitalize on these breaks.
Basically, about once a decade, investors get fearful about some big economic headwind crashing the U.S. economy into a recession. So, they start selling stocks indiscriminately.
This indiscriminate selling causes stocks to fall sharply. But, for certain high-growth companies, revenues and earnings keep going up.
In those stocks, this trading action creates a “divergence” between the stock price and the fundamentals.
Eventually, those big fears always pass. When they do, this divergence turns into a convergence, wherein certain stocks snap back in emphatic fashion to their fundamental growth trends.
These “snapbacks” have historically allowed investors to buy the highest-quality growth stocks at unprecedented discounts — and score triple-digit returns in a year, even if the market drops over that same stretch.
In the long run, investors who capitalize on these divergences at the right time have consistently seen returns north of 10,000%.
In other words, this “divergence” phenomenon (that my team and I are the first in the world to discover) is all about taking advantage of the market’s temporary irrationality, and it is proven to be the best way to make big money in the markets.
But enough talk. Let me show you what I mean…
The First Great Divergence of 1988
Per our robust historical analysis, we have observed large divergences in the market just three times over the past 40 years.
Considering the rarity and size of these divergences, we have decided to call them “Great Divergences.”
Each Great Divergence was borne out of macroeconomic fears. Each created a generational buying opportunity.
Indeed, we’d argue that the market’s three best buying opportunities of the past 40 years were all the byproduct of Great Divergences.
The First Great Divergence emerged in the late 1980s.
Specifically, it emerged in the years between 1988 and 1990. During this time, the U.S. economy was reeling from the so-called savings and loans crises in which about half of all the savings and loan banks in the U.S. closed shop.
There was a lot of fear in the market. All that fear forced investors to sell indiscriminately. This produced enormous divergences in companies with very strong fundamentals.
At the time, the companies with the strongest fundamentals (the fastest-growing companies) were computer companies. I’m talking Apple (AAPL), Microsoft (MSFT), Intel (INTC), and the like. Remember: This era was widely considered the dawn of the computer.
That’s why, at this time, computer stocks saw record divergences. Their revenues and earnings kept growing. Their stock prices collapsed. Yet, because their fundamentals were so strong and those companies continued to grow their revenues and earnings through the market turbulence, their stocks rebounded from these divergences in rapid and significant fashion.
Ever since then, computer stocks have soared!
Net result, out of the First Great Divergence emerged the best buying opportunity in computer stocks that the world has ever seen.
Case in point: Microsoft.
Throughout the 1980s, Microsoft stock hummed alongside its growing revenues. Then, in June 1988, a divergence emerged. Between June 1988 and March 1989, Microsoft stock dropped 26% while its revenues rose 28% — marking a 50-point spread between stock price returns and revenue growth.
It was an epic divergence. And it didn’t last. Within a year of its “peak divergence” moment, Microsoft stock had doubled. Perhaps more impressively, since this Great Divergence peaked in March 1989, Microsoft stock has risen more than 86,000% — turning every $10,000 investment into a $8.6 million payday.
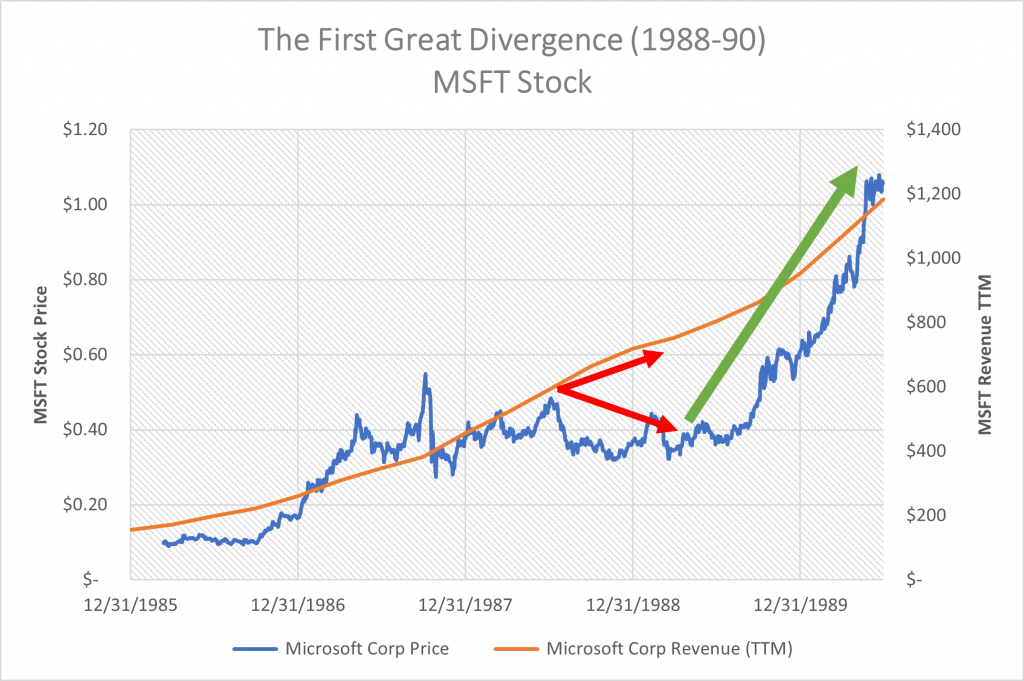
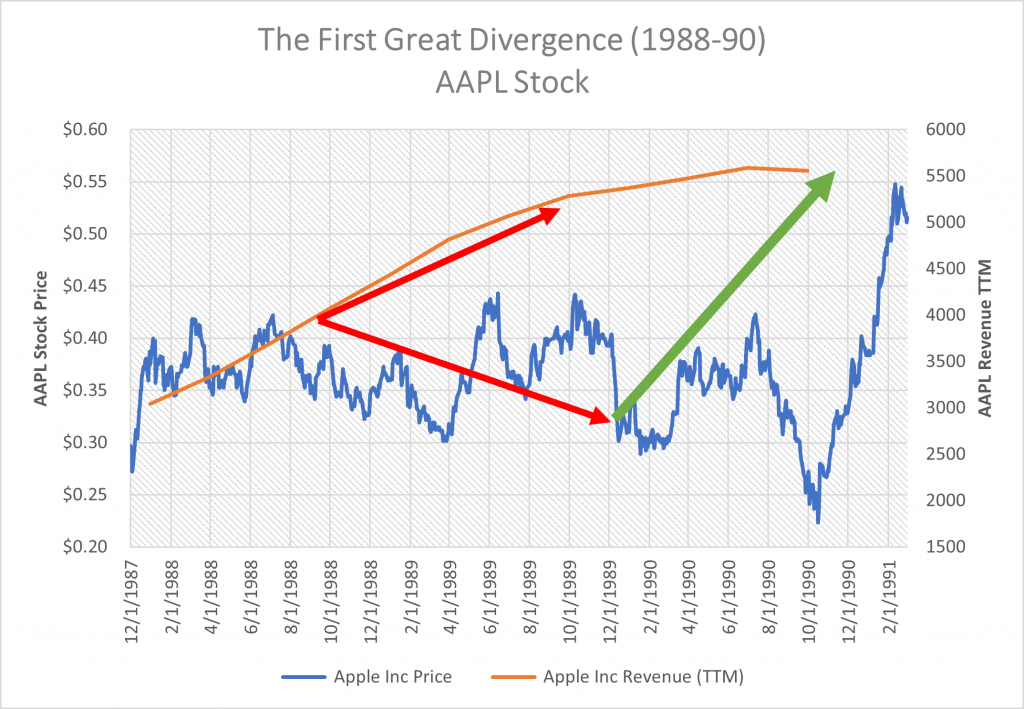
The same thing happened with Apple stock during this time. Between September 1988 and December 1989, Apple stock dropped 20%, while its revenues rose by 32%. That, too, marked a wide 50-point divergence in stock price returns and revenue growth.
About a year later, Apple stock had risen roughly 60% to catch up with its revenues. Three decades later, it’s up 54,720%.
Yet another example from the First Great Divergence is computing giant Intel.
Like Apple, Intel’s big divergence started in June 1988. Over the next six months, Intel stock dropped 43%. Its revenues rose 18%. Again, we see this break of the 50-point spread between stock price returns and revenue growth.
Just over a year later, Intel stock had doubled. Three decades later, it has risen 5,510%.
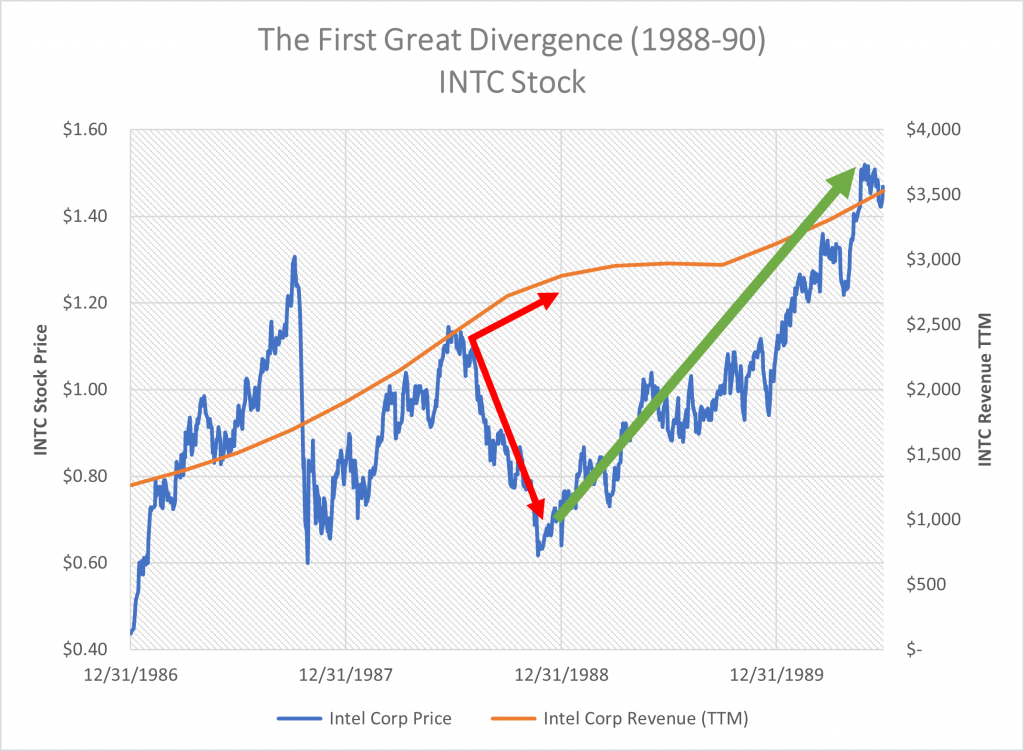
The list goes on and on. Dozens of computer stocks underwent massive divergences in the late 1980s. Pretty much all of them snapped back in emphatic fashion, with most doubling over the following year and rising thousands of percent in the subsequent decade.
But, as we said earlier, the Great Divergence of the late 1980s was just the first Great Divergence of the past 40 years.
And it was actually the smallest. Tomorrow, I’m going to tell you all about the Second Great Divergence!
Until then, just know this:
- We’ve discovered an ultra-rare, never-before-found stock market phenomenon.
- This phenomenon is emerging right now.
- Historically, investors who capitalized on this phenomenon at just the right moment had the chance to turn $10,000 investments into multimillion-dollar paydays.
- We’ve developed proprietary signals to tell us when stocks hit “peak divergence.”
- Our models are telling us that peak divergence is rapidly approaching.
- When we hit peak divergence, we’ll tell you right away — and you’ll be locked in to capitalize on the moneymaking opportunity of the century.
So, be sure to stay tuned over the next few days. Peak divergence could arrive any day now.
You don’t want to miss it.