OK. At this point, you get the picture.
Divergence is the rare stock market phenomenon that my team and I discovered. It involves an “error,” in which certain stocks significantly diverge from their underlying fundamentals. These deviations only emerge during times of peak market volatility. And they always create tremendous buying opportunities. One of these is on the rise right now, with “peak divergence” – the best time to buy stocks to capitalize on the moneymaking opportunity of a lifetime – only days away.
You get all that.
But I promised to tell you about the one thing you haven’t heard of yet: The Third Great Divergence, which I said was bigger than both the first and second.
Alas, then, let’s talk about the biggest divergence in history…
The Second-Worst Economic Period in American History Created Monumental Financial Gains
The Third Great Divergence emerged in 2008.
During this time, the U.S. economy was on the brink of collapse. The housing bubble had popped. Tons of banks were left overleveraged with bad loans. America’s financial institutions were teetering on bankruptcy. And a few did go under.
There was more fear in the market than at any point since the Great Depression. All that fear, of course, compelled investors to sell indiscriminately. This produced enormous divergences in companies with robust fundamentals.
During this era, the market’s fastest-growers were cloud stocks, since cloud-powered applications were just starting to make their public debuts.
And through the financial turbulence, these companies continued to grow revenues and earnings very quickly. Those stock prices, however, did not follow suit – and crashed. This created a huge divergence, which quickly resolved itself (as all do) with the stock prices rapidly rebounding to synchronize with fundamentals.
As it turns out, the Third Great Divergence turned into the best buying opportunity in cloud stocks in history – and, indeed, the best single-stock buying opportunity in history, period.
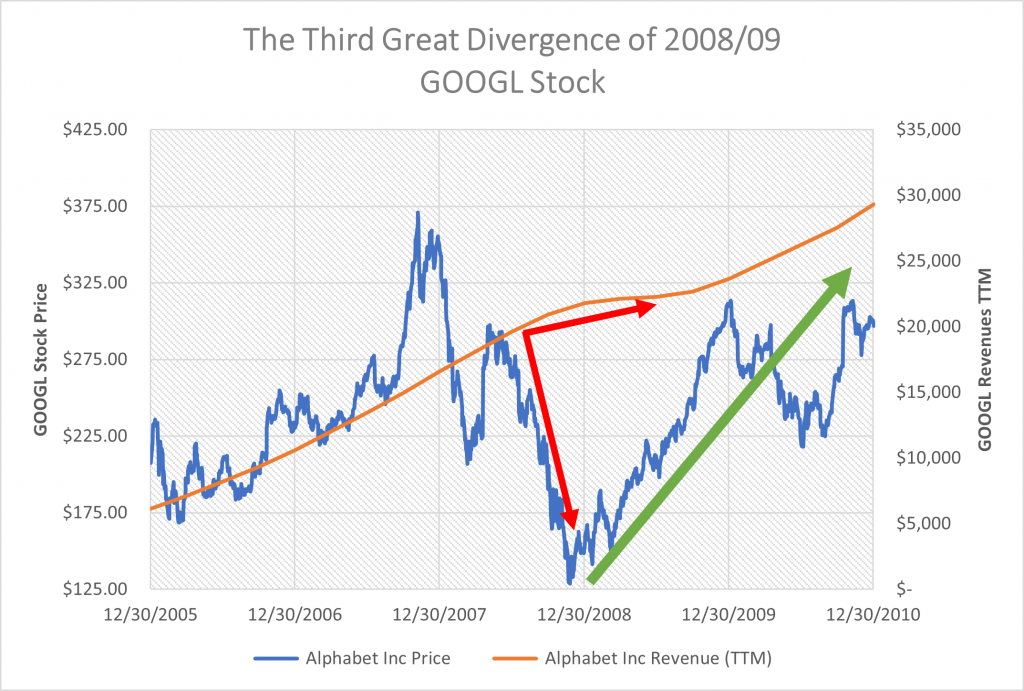
Perhaps the best example is Alphabet (GOOGL). Over a 12-month stretch from December 2007 to December 2008, the stock plunged 56%. Over that same stretch, its revenues rose 31%. This massive 87-point divergence between stock price performance and revenue growth led to GOOGL doubling over the next 12 months.
To date, since this divergence peaked, Alphabet stock has risen 1,690%.
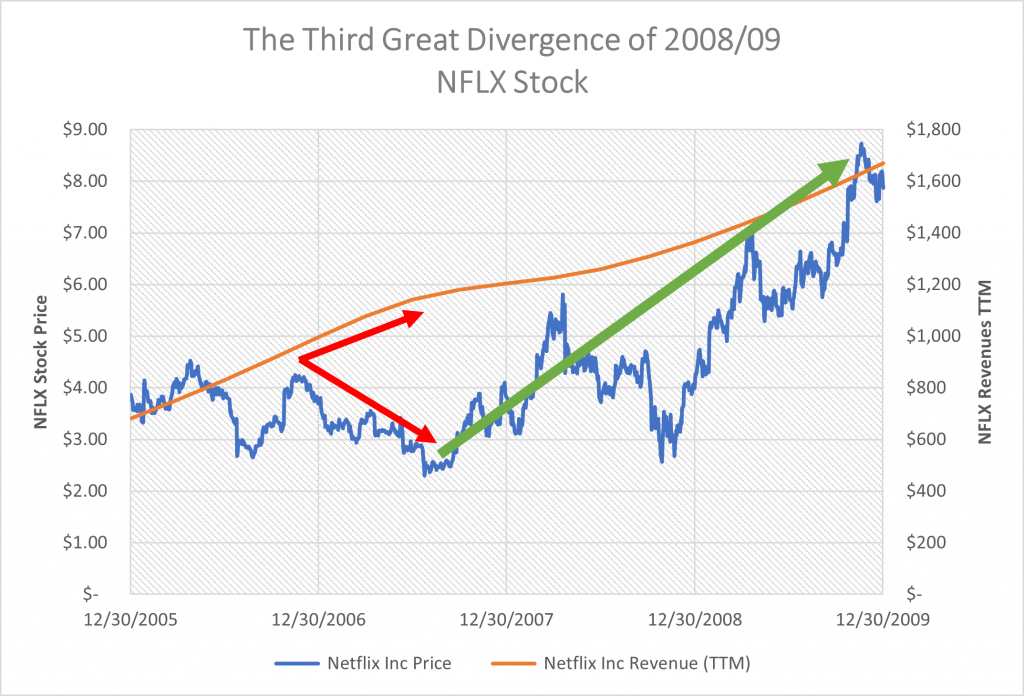
Then there was Netflix (NFLX). It peaked in March 2008. By November of that year, it had crashed 46%. Yet, over that stretch, revenues rose 7% – another 50-point divergence between stock price performance and revenue growth.
A year later, the stock had popped 162%. Since this peak divergence, NFLX is up 12,030%.
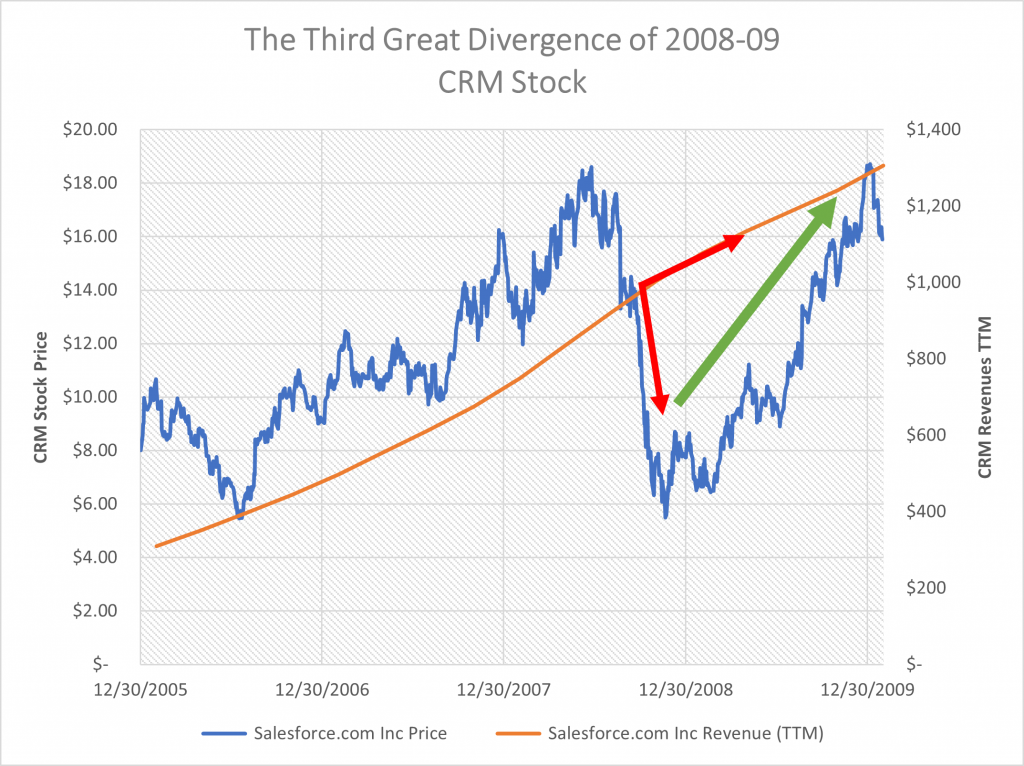
Another great example from the Third Great Divergence is Salesforce (CRM).
The cloud computing giant saw its stock peak in July 2008 – and drop 66% by November of that same year. Yet, over that stretch, revenues rose 9%. And a year later, the stock was up 185%.
Since that divergence, CRM is up 2,860%.
What History Can Teach Us
OK… so, now you understand the context and have seen examples from the first three Great Divergences.
Obviously, they’re great buying opportunities. And obviously, you want to buy blowout divergences in fundamentally strong stocks.
But the million-dollar question is: How does knowing that help me today?
Well, in this instance, the data from our historical examples can teach us quite a bit.
Based on around 30 examples of divergences we’ve analyzed from the past 40 years, we can see that this phenomenon usually lasted about 10 months. During that time, the stocks dropped 60% while revenues rose 50%, creating divergence spreads of more than 100 points.
Forward 12-month returns from that peak divergence moment were about 135% across all the examples. Forward five-year returns were almost 1,000%, with 10-year returns over 3,000%. And forward lifetime returns – more than 20,000%.
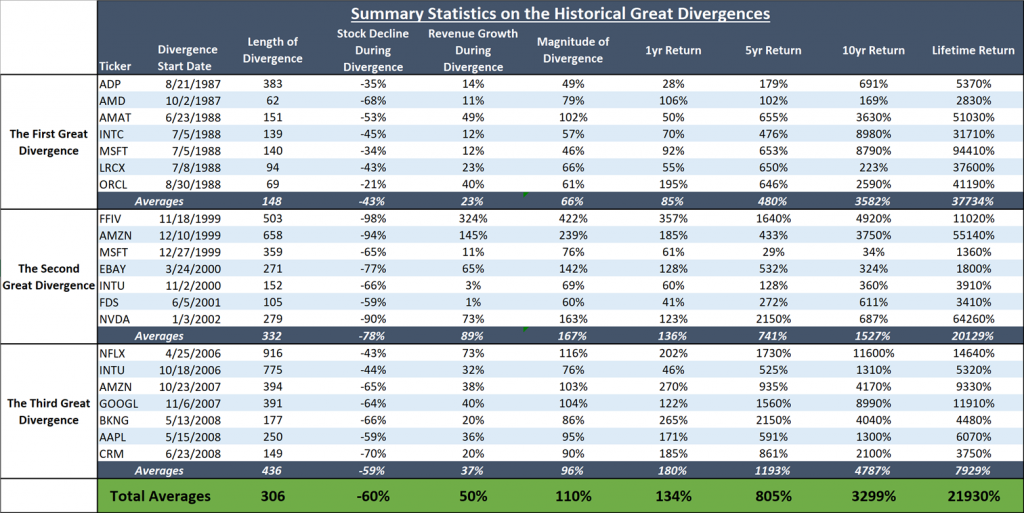
Basically, what the data says is that these divergences take time to play out and usually whack the targeted stocks by quite a bit. But those shares are usually close to or at a bottom when the “spread” hits 100 points. Dip buyers at those levels can expect to double their money in 12 months, 10X their money in five years, and score million-dollar returns if they hold for the long haul.
It’s also worth mentioning that those conclusions are based on average data. But, as you can see from above, each divergence is getting progressively bigger.
In the First Great Divergence, investors doubled their money in 12 months. In the second, investors made more than 130% in 12 months. And in the third, investors tripled their money in 12 months.
Well, folks, today we sit amid the Fourth Great Divergence. Per our analysis, it’s the biggest one in history. Our models suggest that this time around, the current divergence could allow folks to 4X or even 5X their money over the next 12 months.
Alas, I repeat: This is a truly unprecedented moneymaking opportunity.
Throughout my stock-picking career, wherein I jam-packed more than 20 10X picks into just a few years, I’ve never been more bullish than I am right now.
To recap, here’s why:
- We’ve discovered an ultra-rare stock market phenomenon that’s emerging right now.
- Historically, investors who capitalized on this trend at just the right moment had the chance to turn $10,000 investments into multimillion-dollar paydays.
- We’ve developed proprietary signals to tell us when stocks hit “peak divergence.”
- Our models are telling us that height is rapidly approaching.
- When we hit this peak, we’ll tell you right away – and you’ll be locked in to capitalize on the moneymaking opportunity of the century.
So, be sure to stay tuned over the next few days. Peak divergence could arrive at any moment. And you don’t want to miss it.