
If you’re not familiar with me, let me start by saying I’m a Senior Investment Analyst at InvestorPlace – a financial research company based in Baltimore, MD.
In other words, I run a team of elite analysts whose job is to scour the markets for money making opportunities.
Tech startups set to go viral, under the radar stocks with huge upside – you name it.
Over the course of my career, I have identified fourteen 1,000%+ gains…
| JMIA | 1,638% |
| ROKU | 1,065% |
| AMD | 6,149% |
| AMC | 1,321% |
| BLNK | 3,628% |
| SQ | 1,482% |
| NIO | 3,353% |
| PLUG | 2,596% |
| MNMD | 1,548% |
| CHGG | 2,554% |
| SHOP | 1,585% |
| TSLA | 2,261% |
| WKHS | 1,611% |
| GME | 12,066% |
And dozens of gains ranging from 100% to 900%.
As analysts, we rely on a lot of different tools and indicators to help do our jobs…
Some of them are pre-made, and some of them we create ourselves.
A while back, my team and I created an indicator we call the “true price” gauge.
Its purpose was to show us how much a stock should be worth in a rational market, based on its fundamentals.
In other words, it was created to show us when a stock is undervalued compared to its “true price.”
Simple enough, right?
We’ve created tons of indicators like this.
We never intended for this one to be the centerpiece of our stock picking strategy, because frankly, it’s almost never useful.
In fact, we backtested this indicator against the S&P 500 and found that it had a positive correlation of .93…
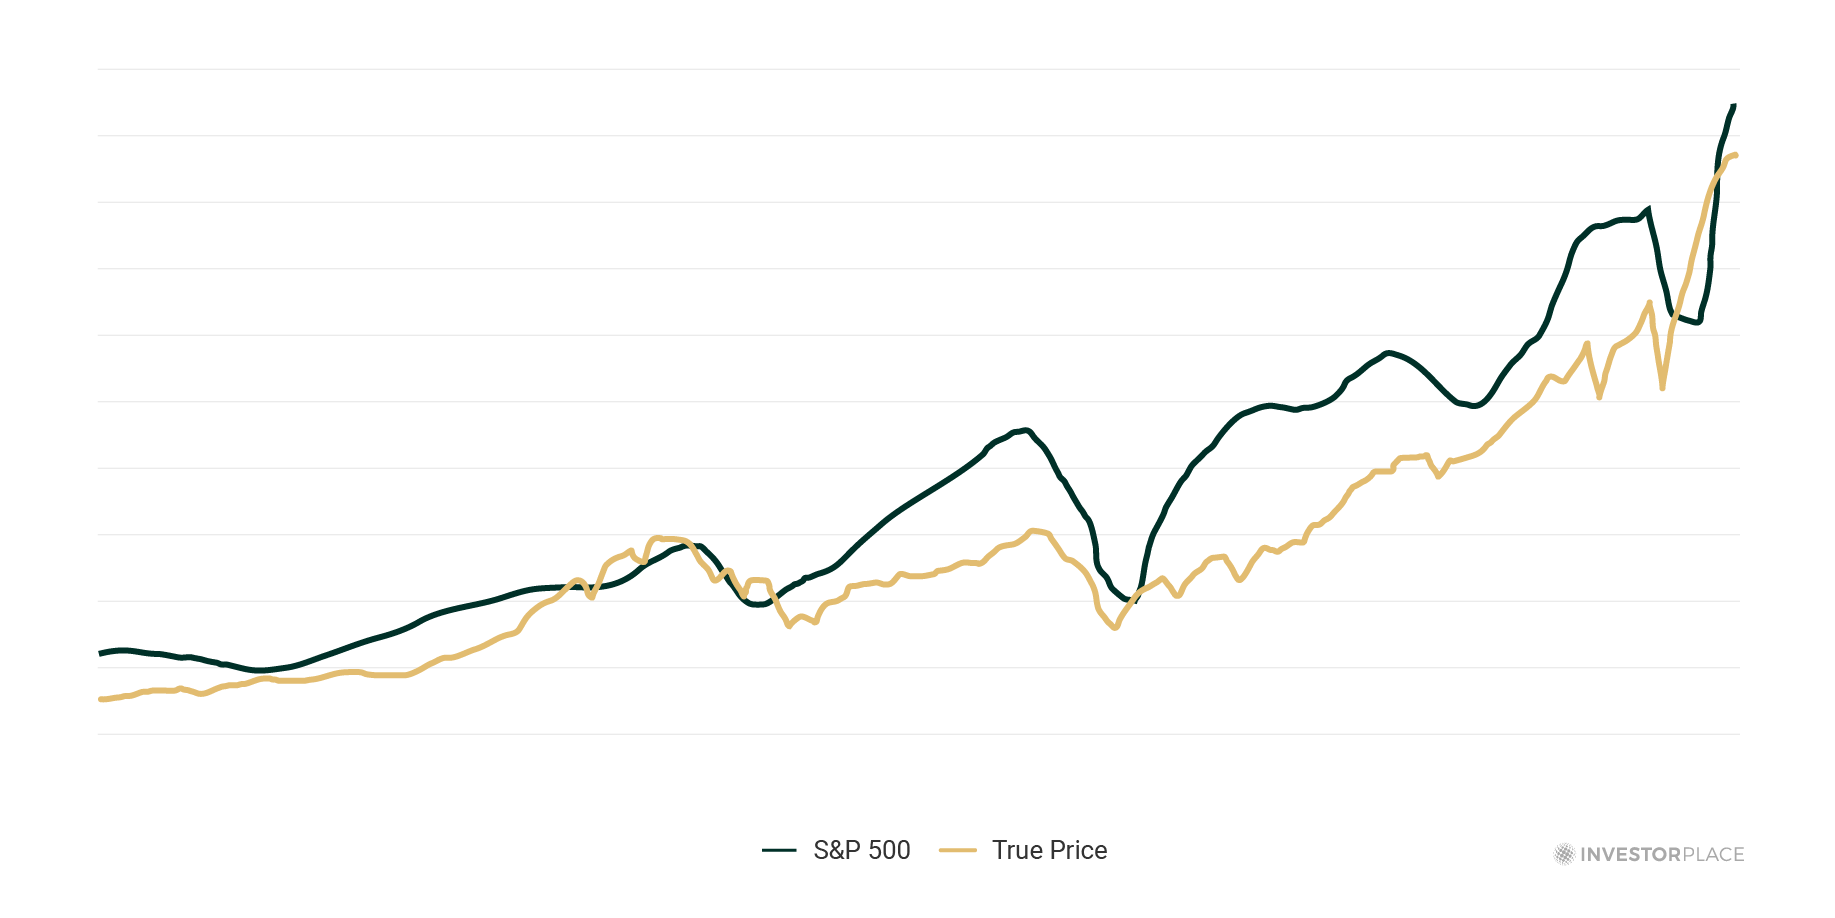
Meaning over 90% of the time, stocks were in lockstep with their “true price.”
This phenomenon held true over and over again… Until it didn’t.
A few months ago, I noticed a strange pattern appearing in a group of stocks…
It looked something like this:
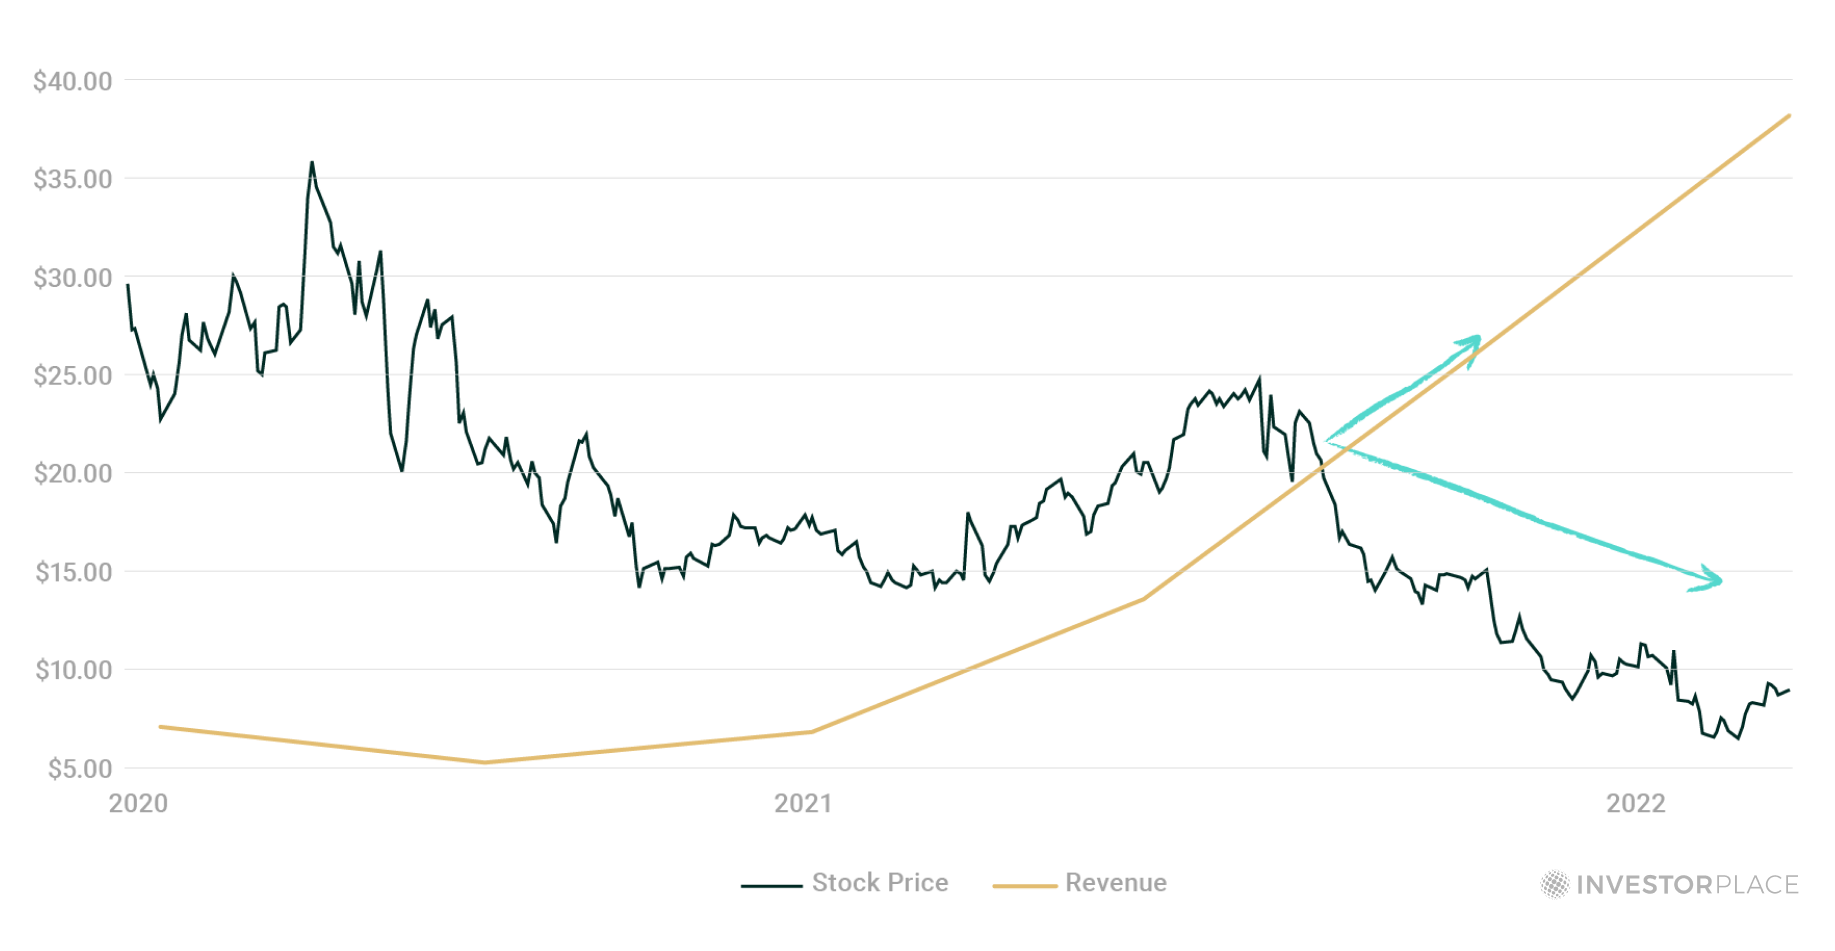
Not only were these stocks completely out of lockstep with their “true price”…
They had trailed away – diverged – by a huge magnitude.
In other words, they were trading for a fraction of what they should have been.
Our “true price” indicator was going crazy.
I couldn’t believe what I was seeing. If our indicator was correct, this group of stocks was on the cusp of exploding.
I had to dig in further…
I started testing this indicator against hundreds of historical charts.
I found a few instances of “true price” divergence here and there…
But it was nothing compared to what the indicator was picking up in 2022.
Then I stumbled into a huge cluster of these stocks shortly following the crash of 1988 – also known as Black Monday.
I pulled dozens of charts from that year and tested them against the true price indicator.
Again, the indicator went crazy.
Not only did these stocks show a divergence magnitude of over 40%…
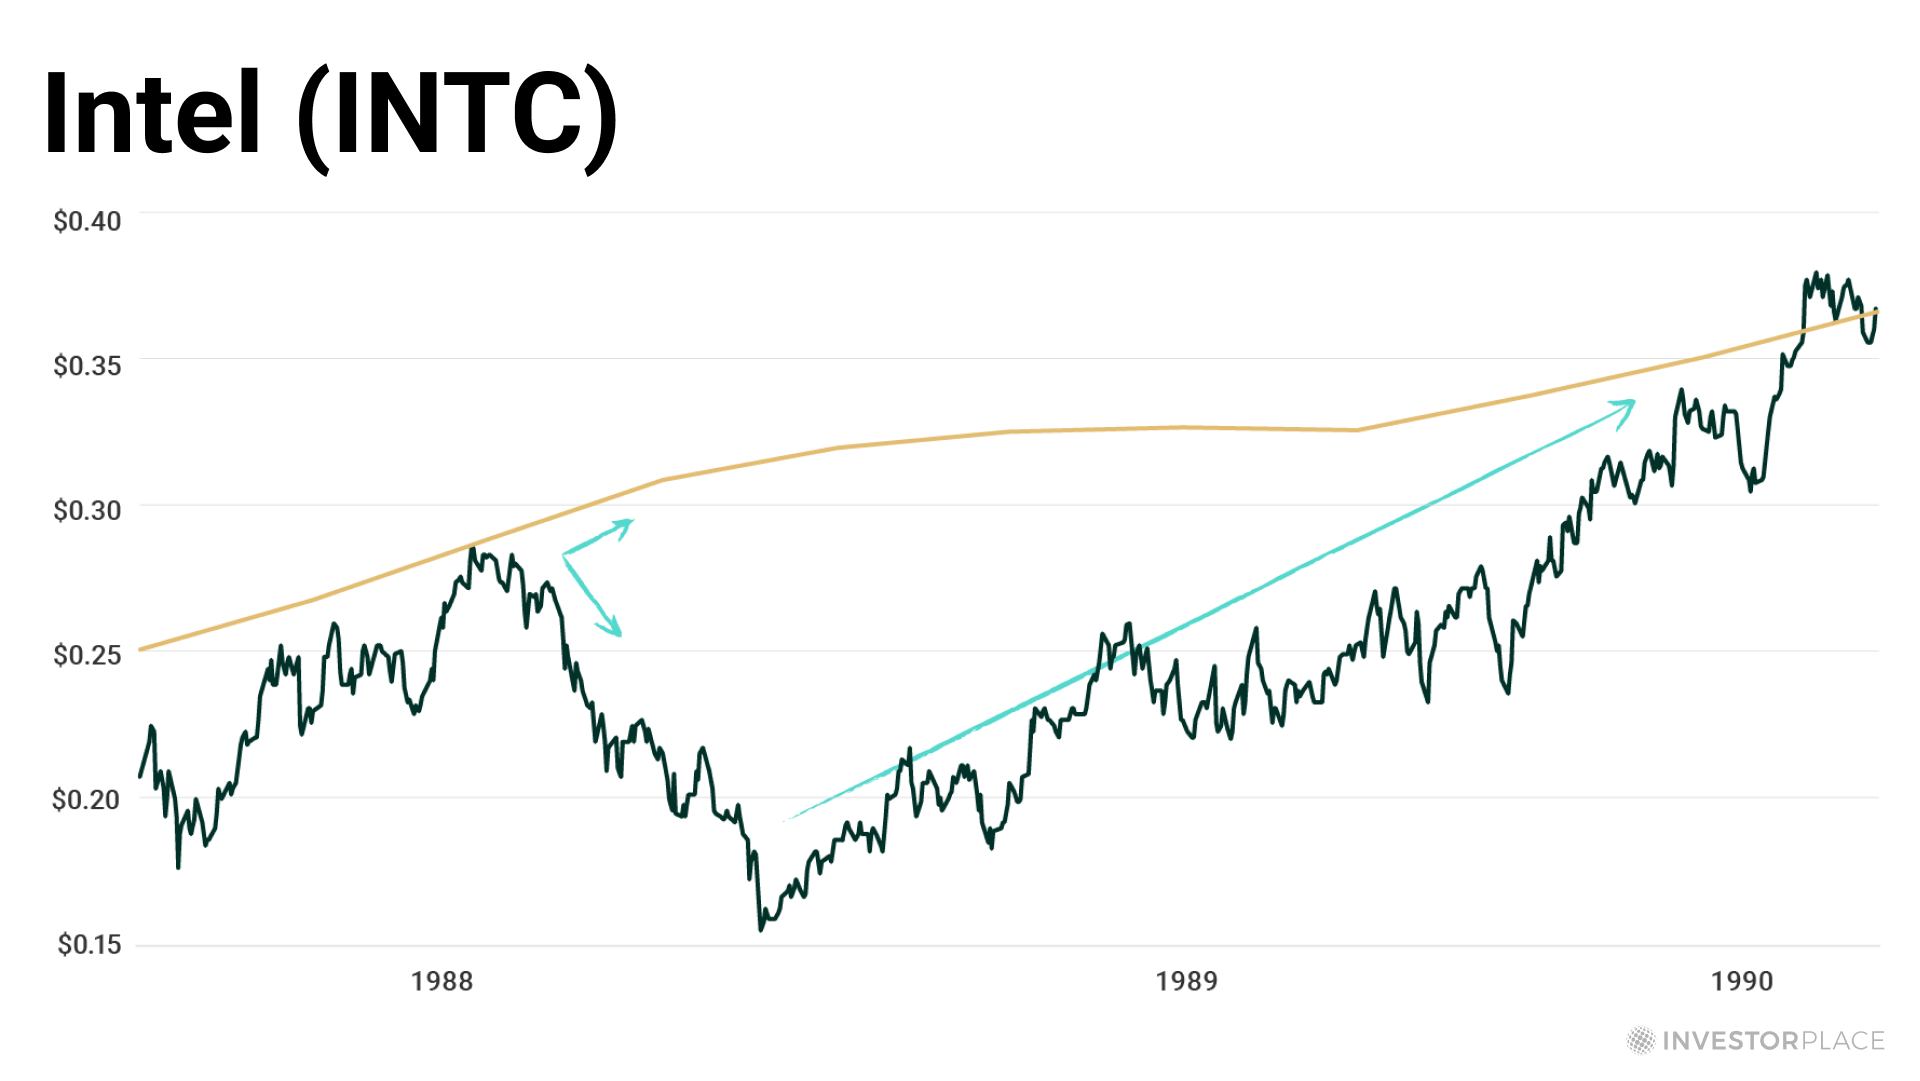
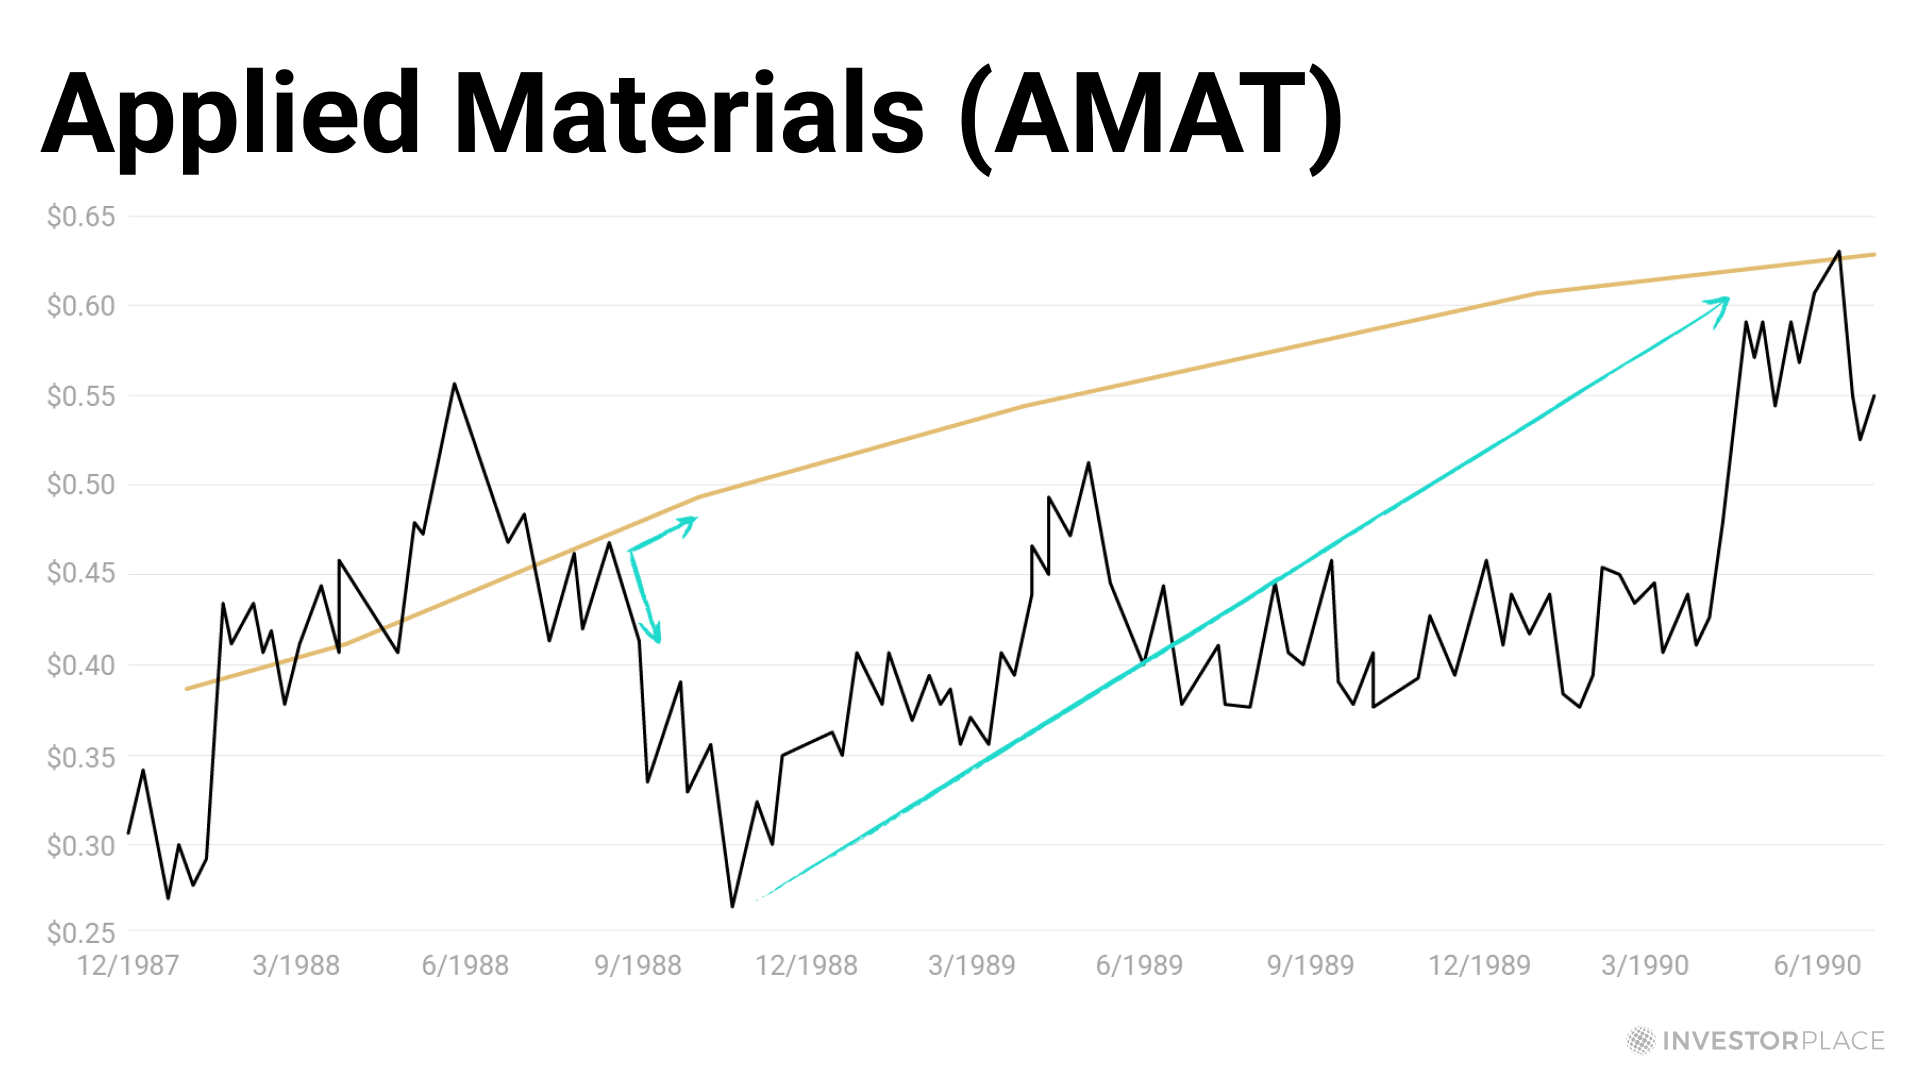
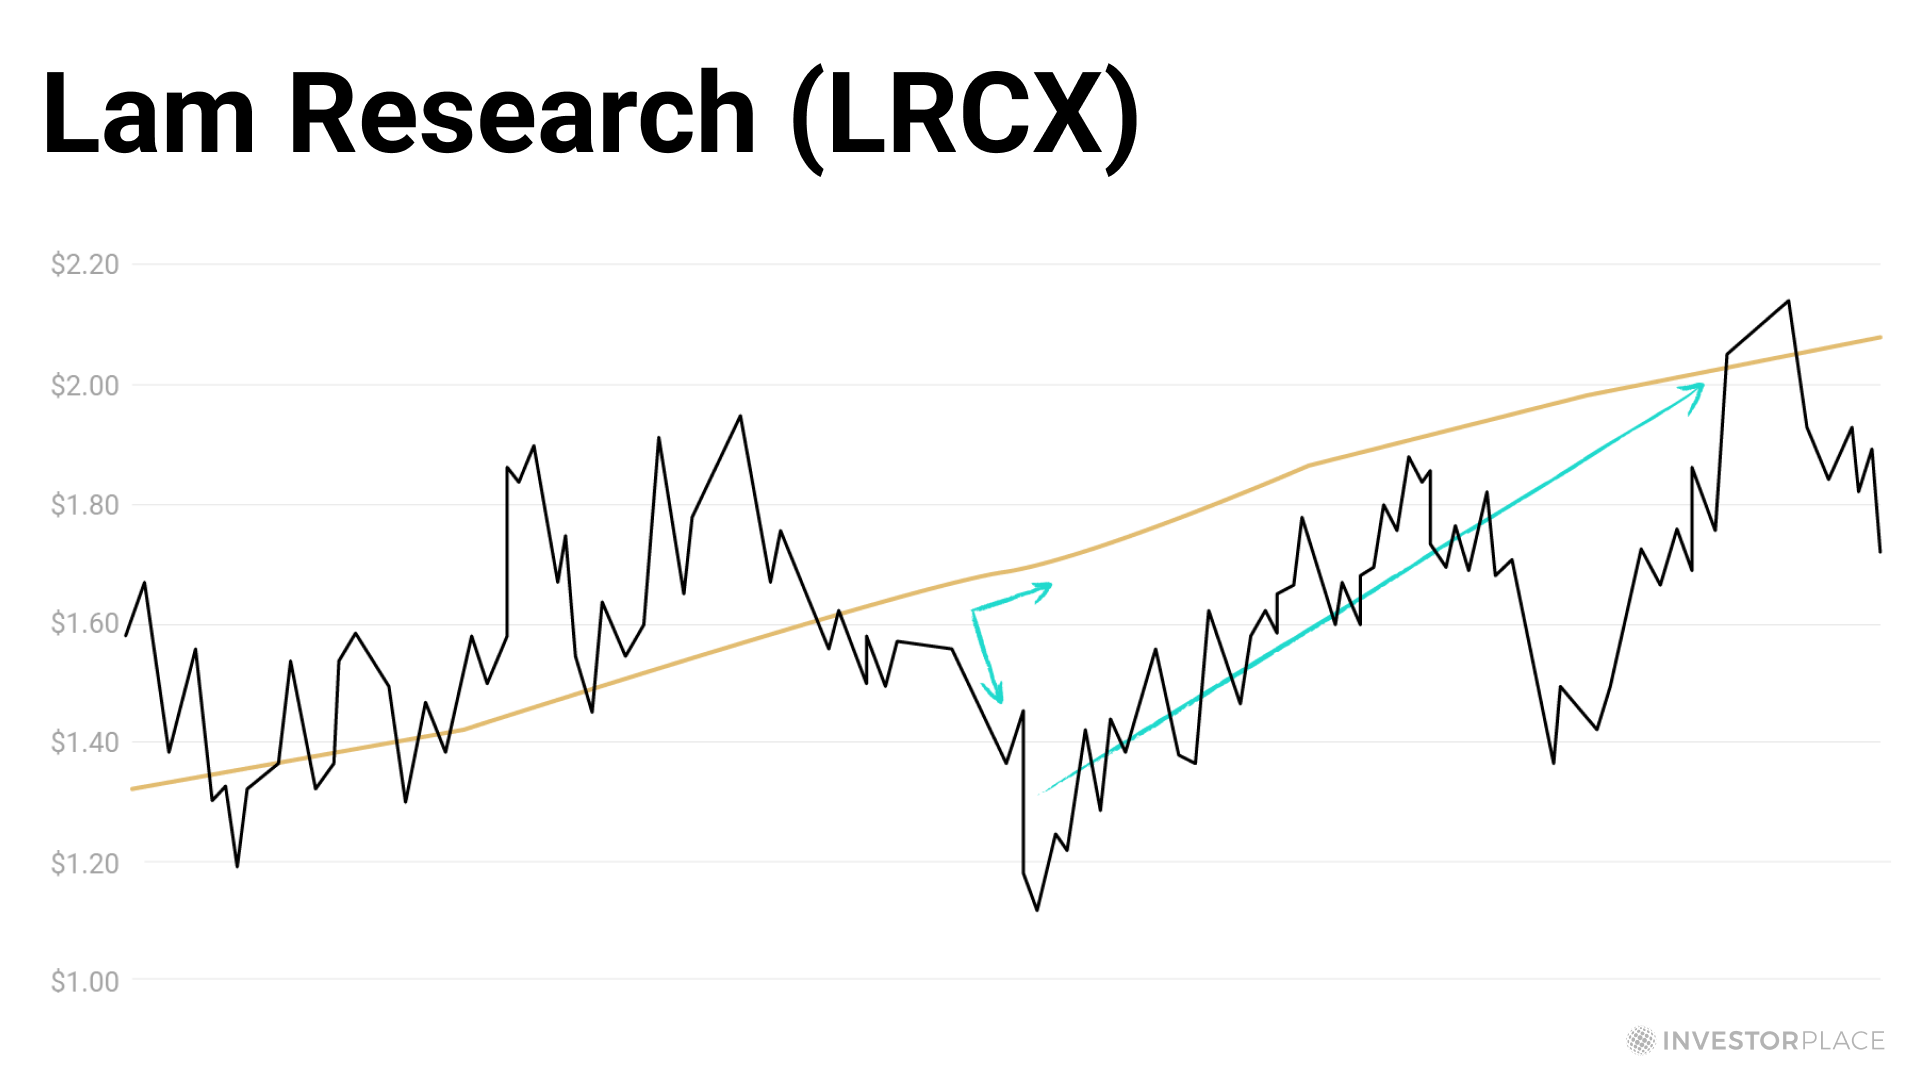
They “snapped back” for astronomical gains.
I’m talking about backtested gains as much as 195% within the span of a single year…
I waited for a response from Louis with bated breath.
I expected him to find some sort of error – to tell me I was wrong and the indicator was malfunctioning.
His response took me off guard.
Here’s the email he sent back:

I dropped what I was doing and gave Louis a call.
I’ll never forget the first thing out of Louis’ mouth when he picked up the phone:
“Luke, I think you may have just uncovered the biggest wealth-building opportunity of the century.”
I asked him what he meant and he told me to check my email again.
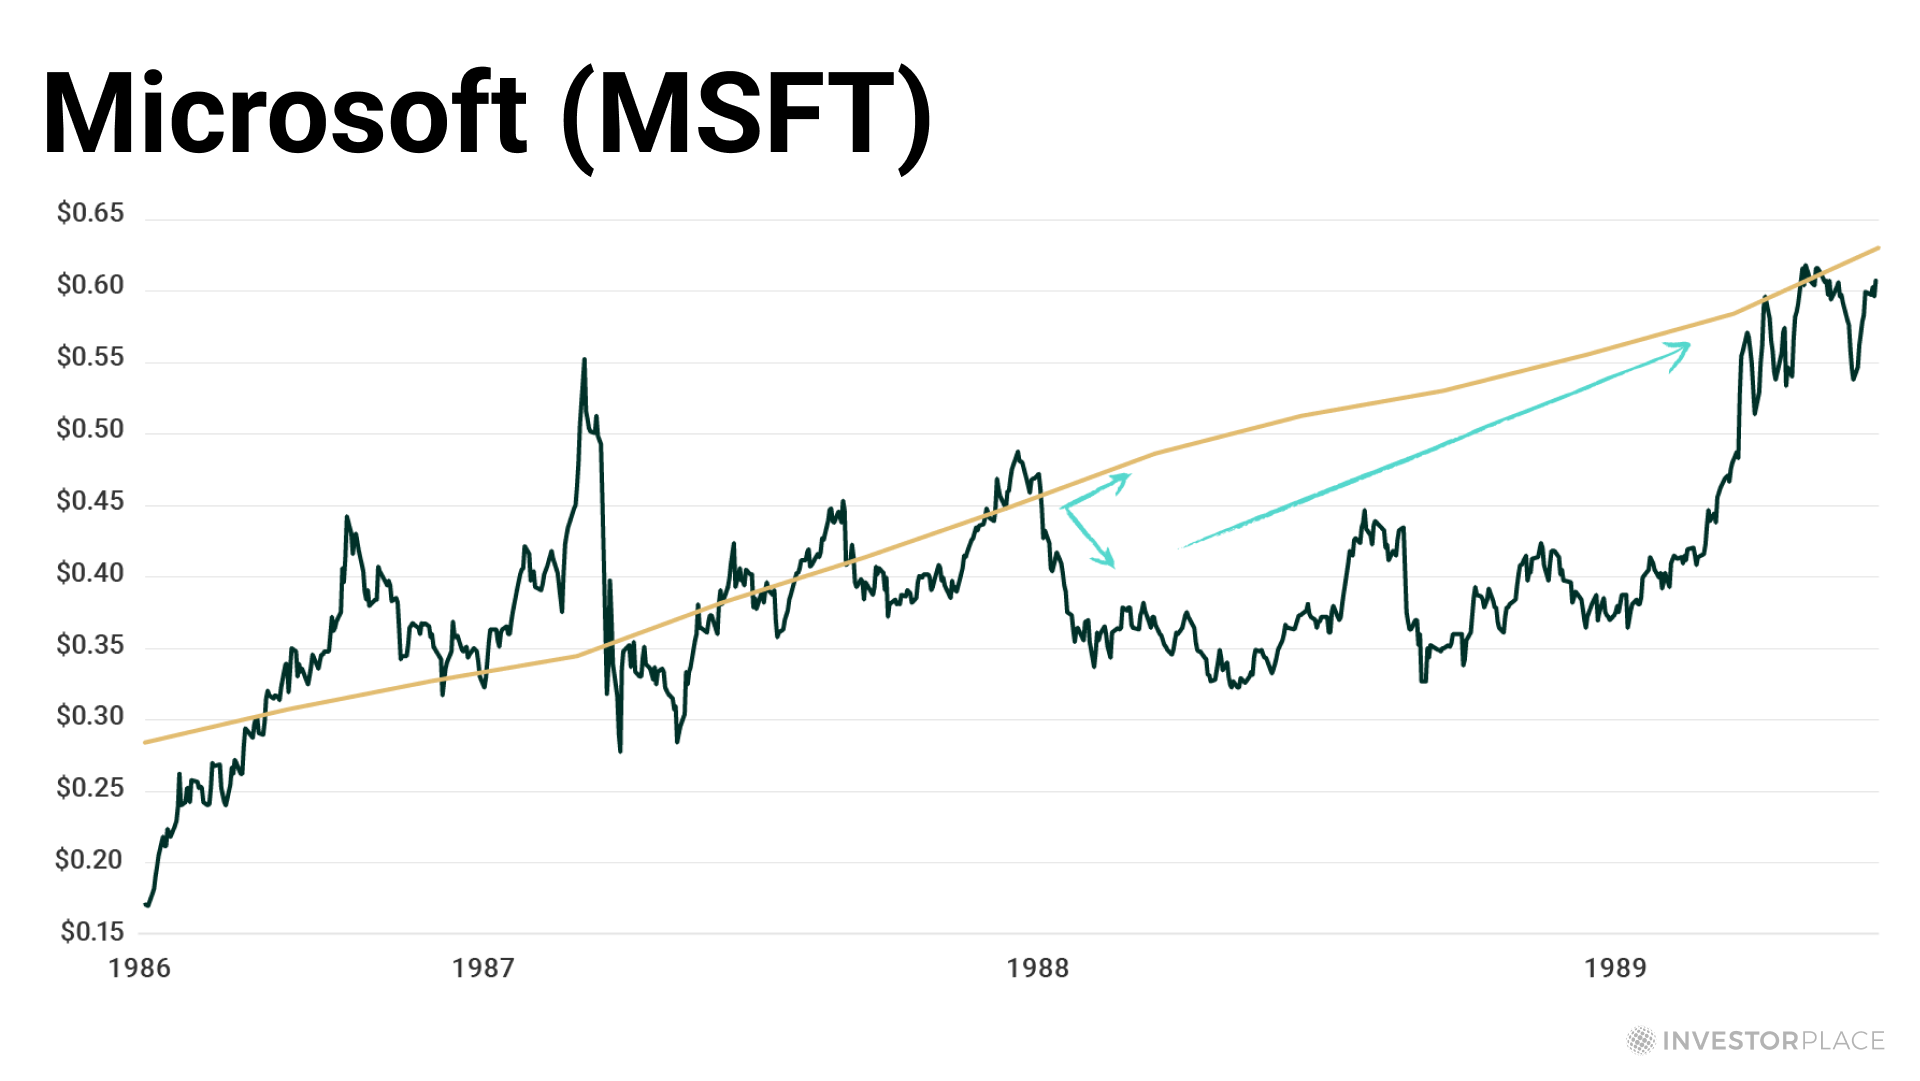
Within a few seconds I received a new message, this time with a group of stock charts…
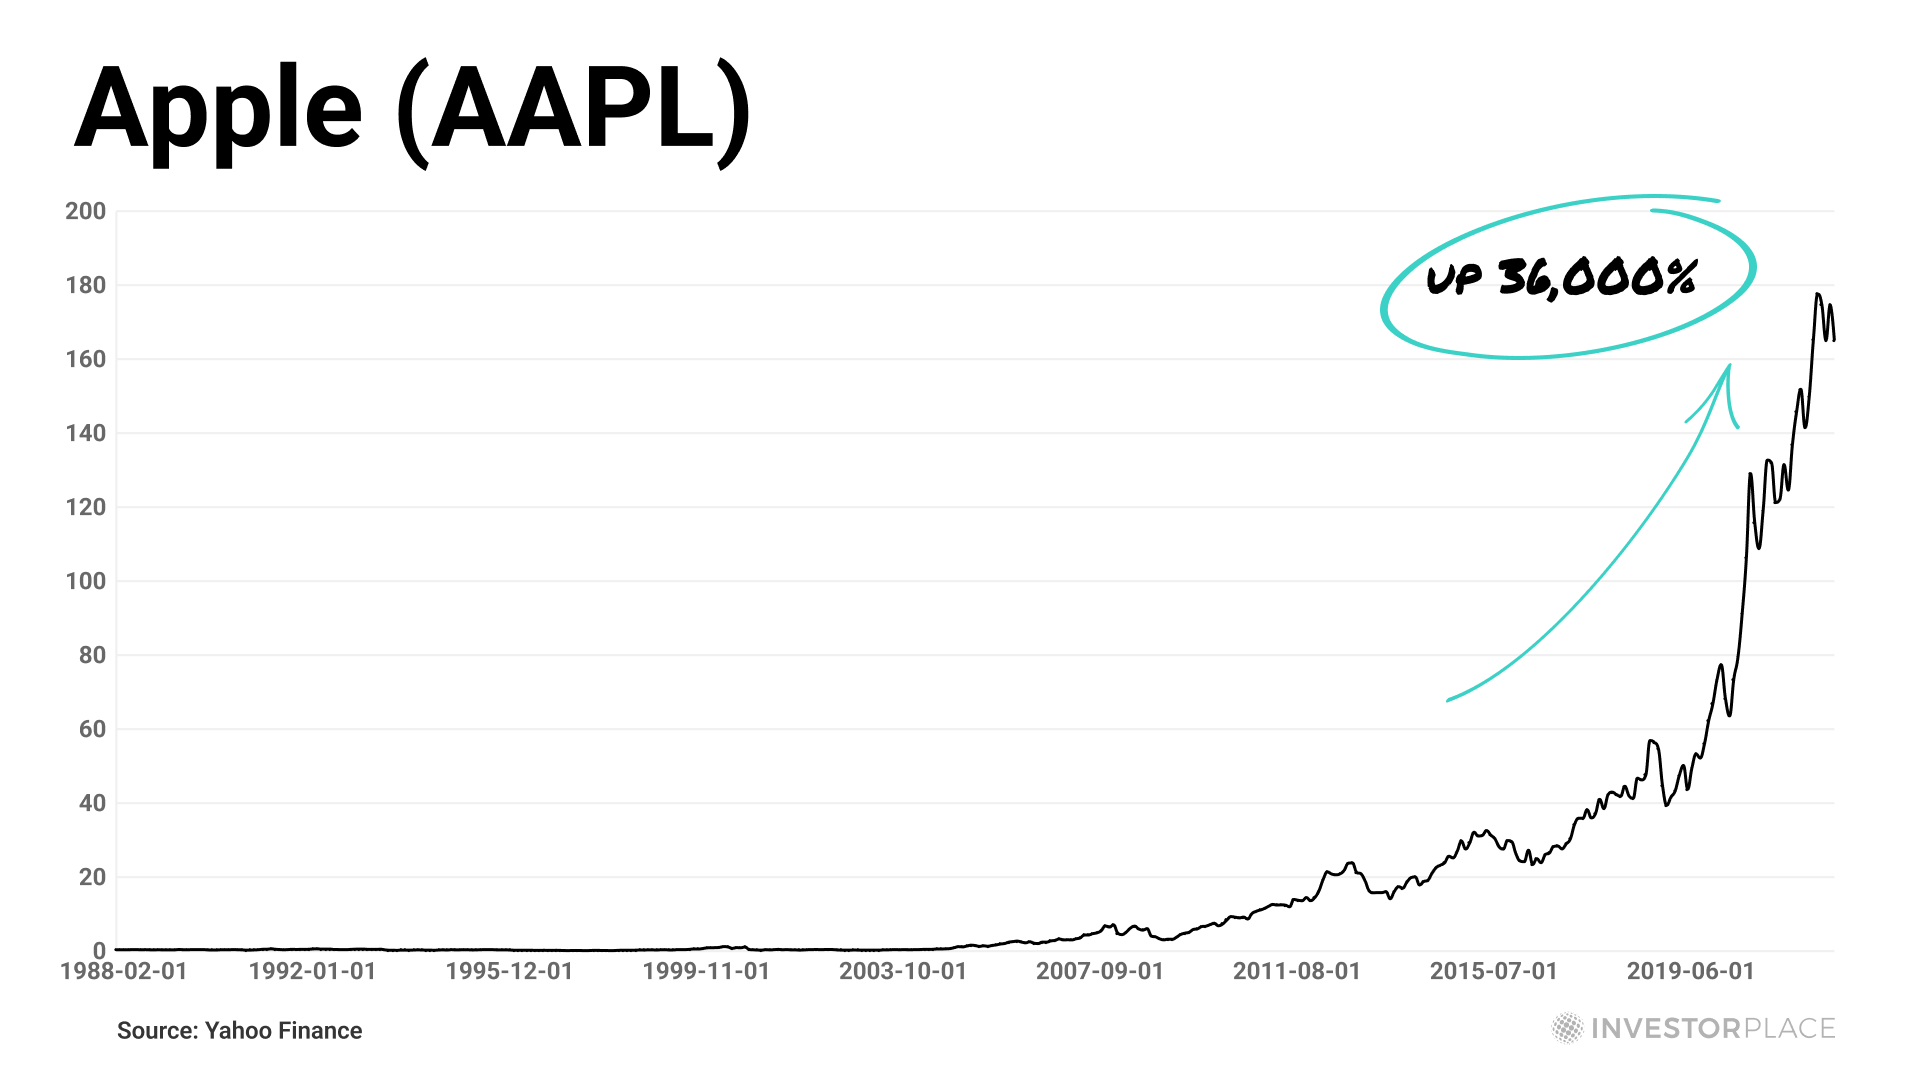
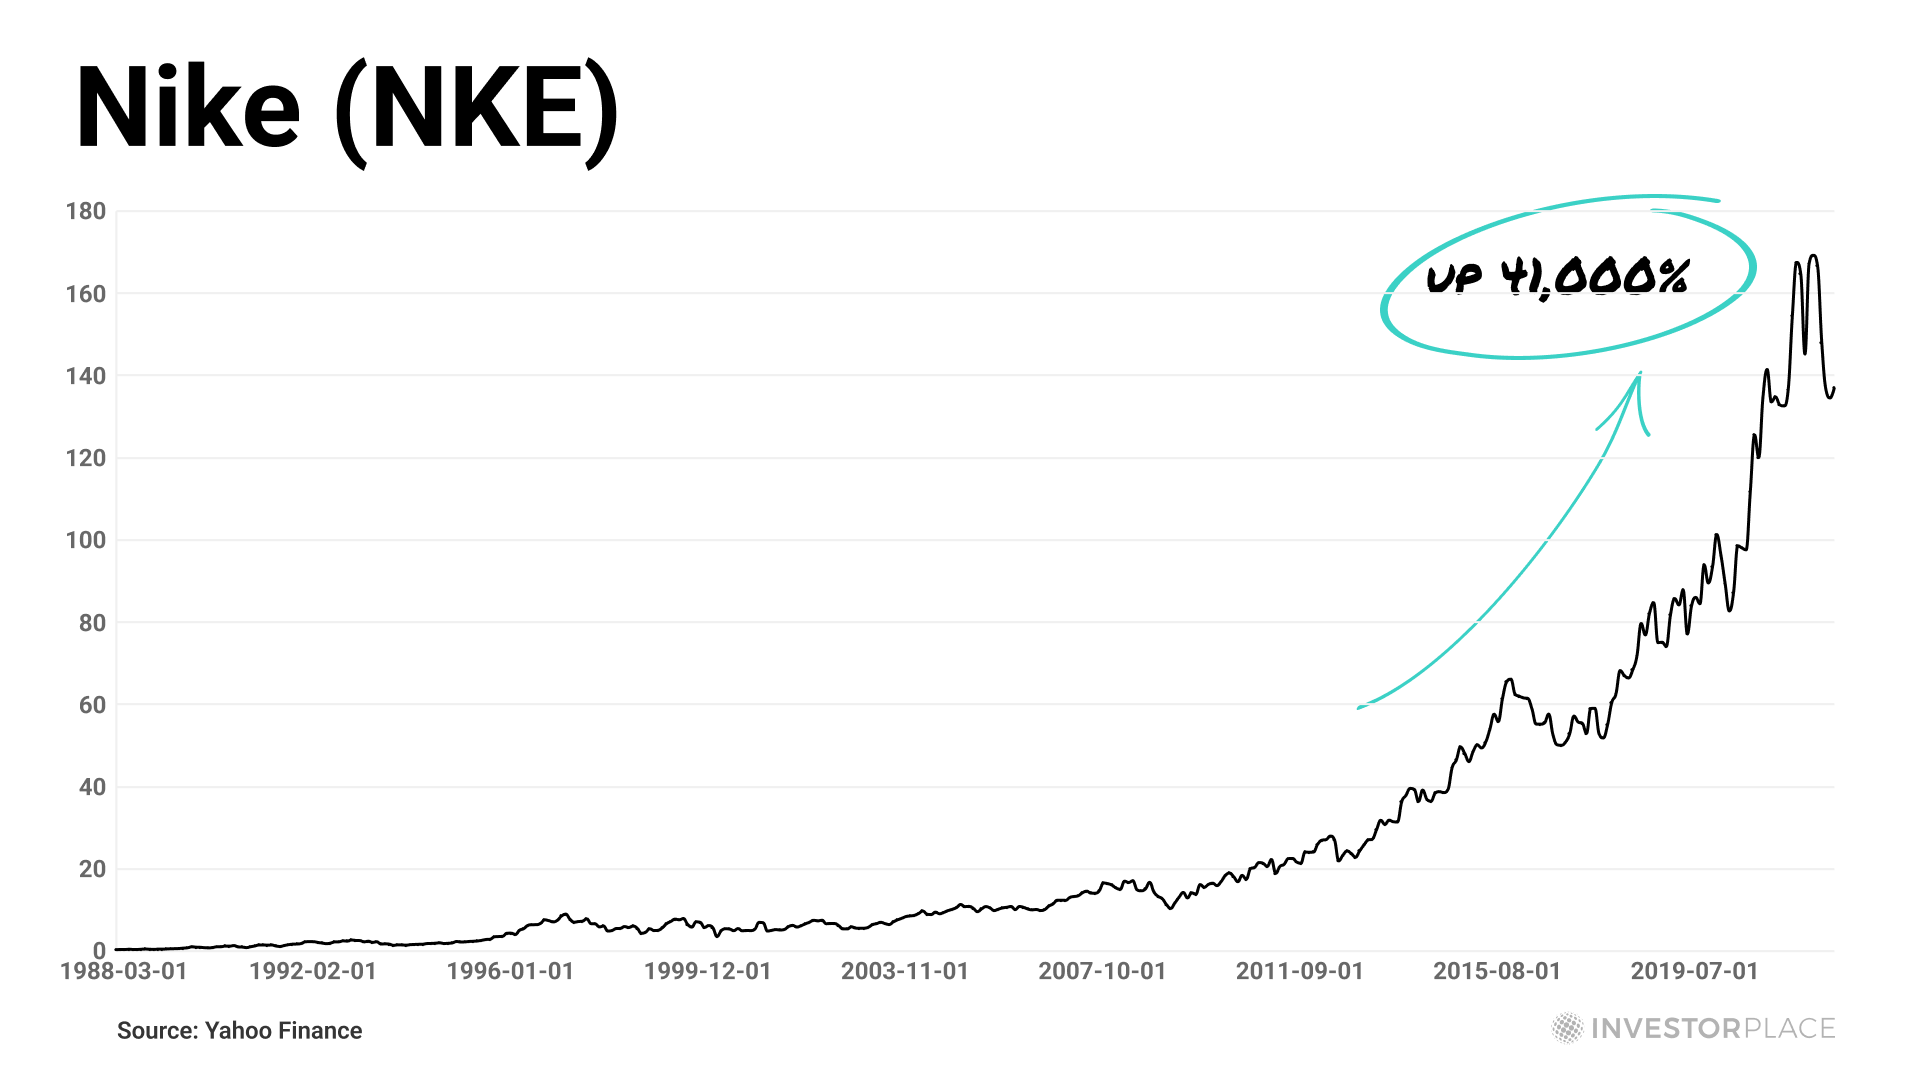
“These are some of the biggest gains I’ve picked throughout my entire career,” Louis said. “Notice anything?”
I spent a few seconds studying Louis’ charts – then it dawned on me…
All of these picks happened during the divergence window I’d identified.
I sat there for what seemed like forever trying to wrap my head around what was happening.
Had I just made the greatest discovery of my career?
Louis spoke up again. “You see it too, right?”
Of course I saw it. It was spelled out right in front of me – screaming at me in plain English.
I had uncovered something huge.
“I think you have your work cut out for you,” Louis said. He hung up the phone.
He was right. I had a lot of work ahead of me, and I needed help.
I called my team into the office and explained the situation.
We were going to figure out every time one of these windows had appeared in the history of the stock market.
We’d leave no stone unturned.
I wasn’t going to go public with this information unless we were 100% confident.
I felt like Michael Bury back in 2008, but in reverse.
Back then, everyone was in denial about the housing bubble, but he was screaming that a crash was coming.
This time, everyone was screaming about a crash…
And I was predicting one of the biggest wealth building opportunities in stock market history.
My team got to work. We worked day and night, scouring through hundreds of thousands of data points… Looking for any indication of one of these windows.
After weeks of searching, we found exactly what we were looking for…
A second divergence window.
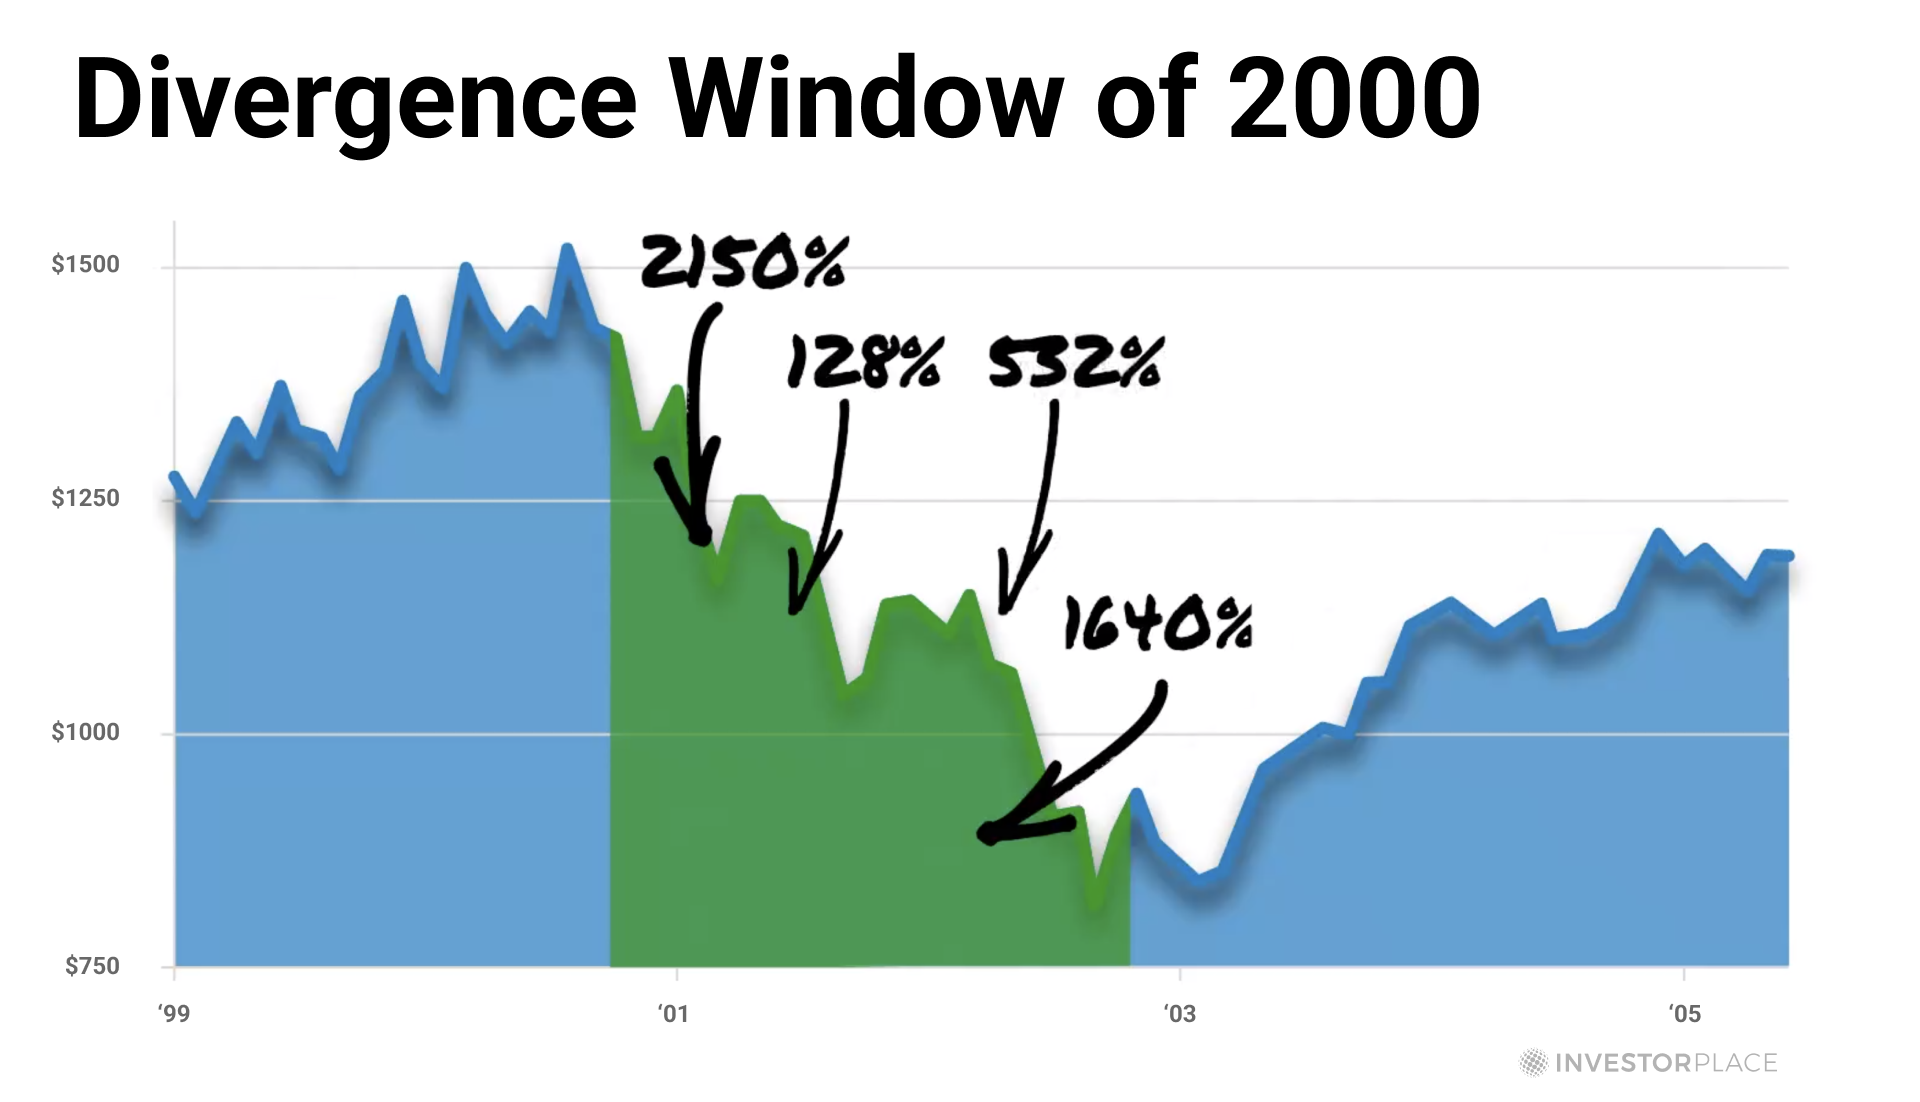
This time in the year 2000, shortly following the Dot Com bust.
Again, we tested our “true price” indicator against countless stocks during the time period following the crash…
And again, the indicator lit up like a Christmas tree.
Bingo.
Now that we had identified another window, we could focus our efforts.
We started pulling up new divergence gains left and right.
The back tested results were…
Well, just see for yourself:
| FFIV | 357% | 1,640% | 11,020% |
| AMZN | 185% | 433% | 55,140% |
| MSFT | 61% | 29% | 1,360% |
| EBAY | 128% | 532% | 1,800% |
| INTU | 60% | 128% | 3,910% |
| FDS | 41% | 272% | 3,410% |
| NVDA | 123% | 2,150% | 64,260% |
| Average Return | 136% | 741% | 20,129% |
The gains from the divergence window of 2000 were mind boggling.
And the short term gains were even bigger than they were in the first window.
At this point I was determined.
But two windows wasn’t enough to establish a pattern.
If I could find one more, I’d be confident enough to go public.
So we did the only thing we could do…
We got back to work.
The divergence window became the talk of the office.
We had discovered two of these windows so far…
And both followed extreme market volatility – just like we’ve seen over the past few months.
With that in mind, it didn’t take long for us to identify a third.
Of course… The great recession of 2008.
Once again, we dove into the time period surrounding 2008…
And once again, we found exactly what we were looking for.
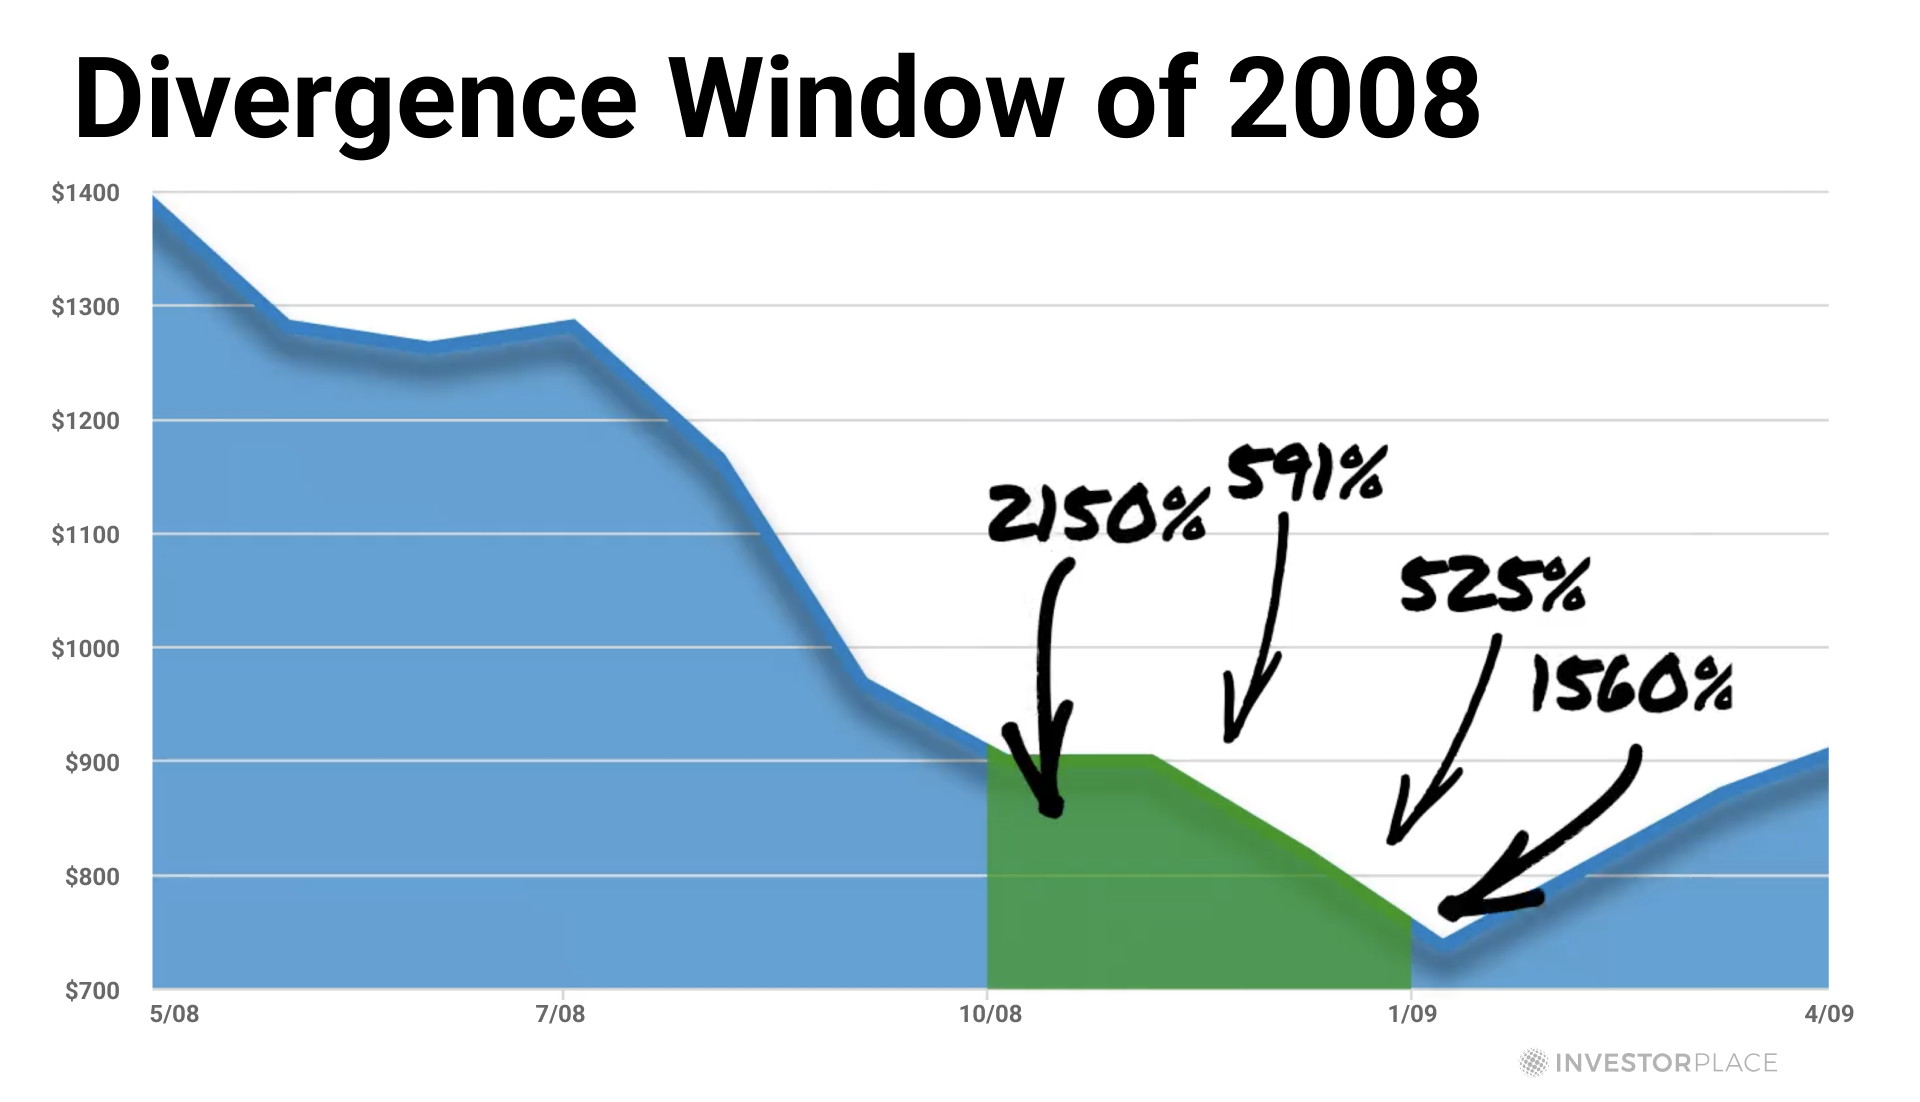
The gains were bigger than ever.
Within 12 months following “peak divergence” these stocks had shot up an average of 180%…
And within 5 years they were showing back tested average gains over 1,000%.
Stock | Phase 1 | Phase 2 | Phase 3 |
NFLX | 202% | 1,730% | 14,640% |
INTU | 46% | 525% | 5,320% |
AMZN | 270% | 935% | 9,330% |
GOOGL | 122% | 1,560% | 11,910% |
BKNG | 265% | 2,150% | 4,480% |
AAPL | 171% | 591% | 6,070% |
CRM | 185% | 861% | 3,750% |
This was the final piece of evidence I needed.
All that was left was to scour through hundreds of current stocks and identify exactly when peak divergence was going to hit in 2022.
That brings us to today.